TL;DR
- Connecting Claude or ChatGPT to your CRM or Marketing Automation Platform (MAP) makes marketing reports easy to produce, but not reliable. AI reads raw data as it is, guesses where things live and how they connect, and can give a different answer every time you ask.
- Reliable AI marketing reporting and analysis depends on three components underneath it: a measurement framework (what to measure and how), an analytical data model (rebuilding what your systems don't track) and a semantic layer (finding, classifying and maintaining every data source).
- You can build all three in-house. In the in-house builds we've seen, teams typically dedicate 3–5 people, spend at least a year, often 12–24 months, before the answers can be trusted, and budget $500,000 or more a year. The work never really ends.
- Building makes the most sense if you already have a data team and warehouse, requirements no platform fits, and the appetite to own it long-term.
- A purpose-built platform like Passetto gives you all three on top of your existing systems, so your team can focus on acting on the answers instead of building the foundation.
Introduction
Connect Claude or ChatGPT to your CRM and you'll have a polished marketing report in minutes. Whether that report is right is a different question. Pipeline and marketing reporting is one of the areas more and more teams are exploring with AI, and rightfully so. It's exciting to see what AI can do here, because:
- We know the limits of the native reporting in our CRMs and Marketing Automation Platforms (MAP).
- As marketers, we need better telemetry into marketing performance than traditional reporting provides.
- We recognize the limits of relying on RevOps to build new reports, or waiting on them for answers.
- We want to use AI to automate recurring reports and tasks, and to have agents run analysis for us.
And the stakes are rising. Go-to-market strategies are evolving fast. With zero-click search, dark social and a growing focus on building buyer preference long before anyone fills out a form, much of marketing’s impact happens where traditional reporting can’t see it. Getting a more complete picture of marketing performance, beyond MQLs, last touch and even multi-touch attribution, is now imperative.
What marketers need is better data, so they can see the full impact of marketing connected to commercial outcomes, and AI can absolutely be a catalyst for that. People want the autonomy to explore the data on their own and see what's happened with more fidelity and a wider aperture.
But because AI-generated reports and dashboards are so polished and seemingly so easy to create, it's easy to overlook what has to be true underneath them. Producing the reporting interface itself is the easy part. Getting accurate, repeatable answers, with the depth and precision of a true view into marketing performance, takes far more than connecting your CRM or marketing automation platform to Claude or ChatGPT.
Key terms
A few terms come up throughout this guide. Here's what we mean by each.
- Measurement framework. The agreed set of KPIs that covers the whole buyer journey, how each one is calculated, and where to look when one of them moves. For example, deciding whether an event registration counts toward marketing influence, or only an attendance.
- Analytical data model. The logic and structure that turns raw records into what the measurements need, including things your systems don't record on their own, like each separate attempt to turn a lead into an opportunity.
- Semantic layer. The translation layer that maps every raw data source to one consistent definition, so "paid search" means the same thing whether it came in as google / cpc, a click ID or a campaign name.
- ETL (extract, transform, load). The process of pulling data out of your systems, cleaning and reshaping it, and loading it somewhere it can be modeled and queried.
- Lead type. The reason someone was handed to sales in the first place, like a demo request, an event hand-raise or a referral.
- MQL / prospect lifecycle. One attempt to turn a lead into an opportunity. The same person can have several over time.
- MCP (Model Context Protocol). A standard way to connect AI tools like Claude to outside data and tools, so they can query a governed source instead of raw records.
This guide covers exactly why that is, and what's involved in evaluating what's best for your own organization: building the capability in-house, or plugging in a platform like Passetto that makes AI reporting, analytics and agent analysis possible on top of your existing data.
Why isn't connecting AI to your CRM enough?
Claude, or whatever you use to create reports, dashboards or presentations, is the last mile: the reporting interface, and the final component of the mix. The real work happens before AI ever touches the data, in the measurement framework, the data model and the semantic layer that make the answers possible and reliable in the first place.
It's easy to ask Claude a question and get an answer. The real question is whether the answer is accurate. AI is great at analyzing the data you give it. The problem is that raw CRM and marketing data isn't typically ready to be analyzed as it is. Two things are usually missing. The first is the structure and shared definitions AI needs to find the right records. The second is a model: the logic that tells AI what to do with those records once it has them, like how to connect a lead to the deal it influenced, how to rebuild a buyer's journey over time, and how to calculate each metric the same way every time. Without both, AI has to guess, and it can guess differently every time you ask.
This guide is for marketing leaders who are being pushed to adopt AI, want to start with analytics, and want to generate great reports on their own with more depth and visibility into what's happening. It covers the most important things to know, drawn from Passetto's work inside the CRMs and MAPs of hundreds of B2B companies. Those companies range from $5M to more than $500M in annual revenue and span every level of maturity and go-to-market complexity, including years of acquisitions, merged CRMs and immense technical debt.
We see the same pattern again and again. A finished report, presentation or dashboard, like qualification rate to pipeline for a specific lead type, speed to lead by lead type, or event-influenced and event-sourced pipeline, looks simple. So people assume that if the raw data exists inside their systems, they can generate it themselves using AI. And it can be done. But the complexity is easy to overlook, and it often costs far more than companies expect, in both people and time. That's most pronounced in larger, more complex companies, with more systems, regions and teams to reconcile. But it applies just as much to smaller, less mature organizations, where data tends to be messier and there are fewer resources focused on fixing it.
What does reliable AI reporting depend on?
It's also rarely about whether your data is a mess. Some teams assume that if their data is messy, they need to clean it up before AI can help. That's partly true. Others assume that if their data is clean and their hygiene is good, AI should work just fine. That isn't true either. Everything in this guide applies to both. What matters is whether anything turns your records into the structure, definitions and relationships that marketing questions actually depend on. What sits between that data and a reliable answer are three incredibly important components that should never be overlooked. Anyone who wants the same level of integrity and depth in their AI reporting would need all three, and they're the foundation Passetto is built on:
- A measurement framework. Knowing what to measure, how to measure it, and where to look next when a measurement surfaces a trend. It's grounded in decades of knowledge and best practice, and it's where every other decision starts.
- An analytical data model. The architecture that reconstructs raw marketing and sales activity into what the measurements need, including things your source systems don't track at all, like every attempt to convert a lead into an opportunity.
- A semantic layer and infrastructure. The extract, transform and load work that finds every raw data source, classifies it against one consistent set of definitions, and keeps it current as new data flows in.
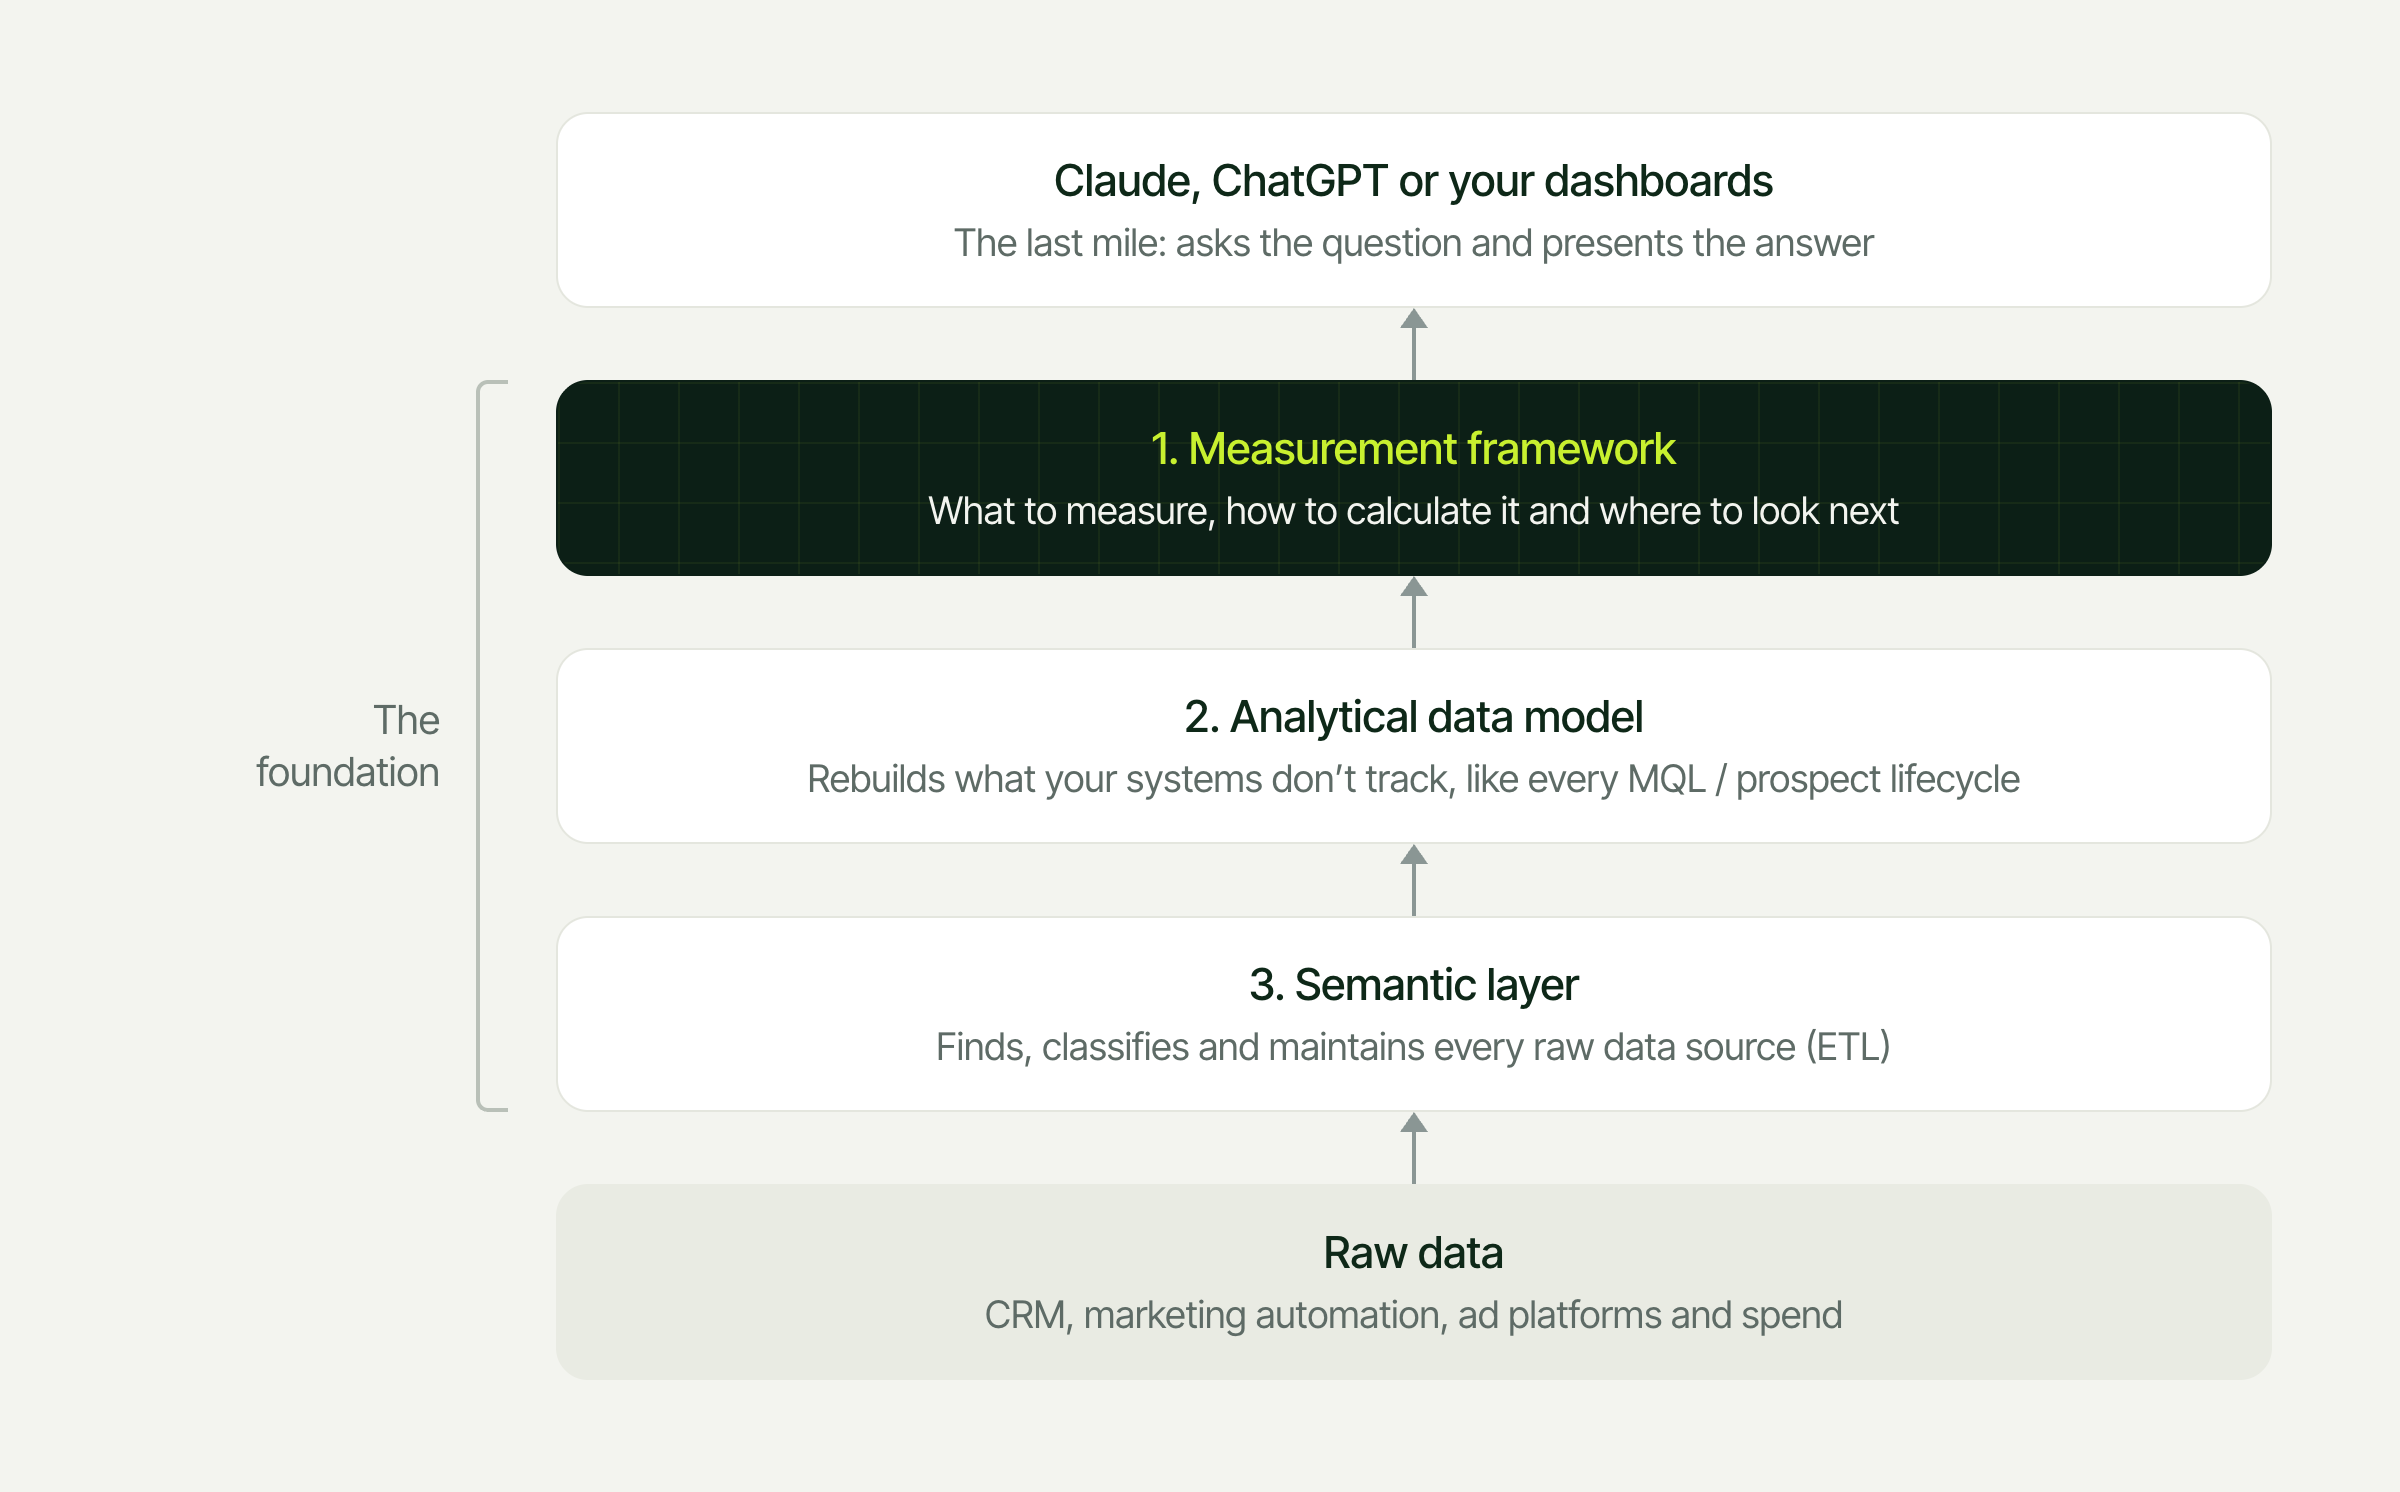
That's why connecting your systems directly to AI doesn't, and will not, produce the same results you'd get from Passetto or any professional, enterprise-grade measurement platform. Each of these is explained in more detail below.
Why is marketing analytics one of the best uses of AI?
If your leadership or board wants to see AI adoption in marketing, pipeline and performance reporting is one of the highest-return places to begin.
Marketing reporting today is manual and time-consuming, and many would characterize it as "data gymnastics." Many marketing teams spend hours every month pulling exports, scrubbing deals in spreadsheets, and rebuilding the same views for QBRs and board decks manually. AI tools like Claude and ChatGPT can turn that into a question you ask in plain language, and they can render the answer as a dashboard, a slide or a report in whatever shape you need, quickly and with designer-quality polish.
Done well, the payoff goes far beyond saved hours. It's answers to the questions that are critical to the business, and to your success in your role. Questions that are impossible to answer today become clear, and that changes how your team operates and executes every day.
What does it make possible?
- Answers to the questions that matter most. Which programs are actually creating pipeline? Which types of leads convert, and which stall? Where are buyers falling through the cracks between marketing and sales? These are the questions leadership and the board ask, and the ones traditional reporting can't easily answer.
- Clarity where there's been guesswork. See what's happening at every stage of the buyer journey, including the engagement and lead hand-offs your systems were never designed to track well. No more filling the gaps with assumptions, or manually scrubbing data to piece the answer together.
- Decisions based on leading indicators. When answers are always on, teams stop waiting for quarter-end results and act on what's happening now: slow lead follow-up, stalled pipeline, budget tied up in programs that don't convert. Some of our customers now get automated pipeline updates delivered straight to Slack.
- A single source of truth. Marketing, sales and leadership ask the same question and get the same answer, instead of arguing over whose report is right.
- Measurable performance lift. For the first time, you have the data to work out how to grow pipeline and revenue, not just report on them. Acting on those answers shows up in the numbers: higher qualification and win rates, faster speed to lead, and budget that goes where it works.
The catch is in the phrase "done well." The flexibility that makes AI dashboards so appealing is the same thing that makes them dangerous when they read raw CRM data directly.
How does each component work?
Here's each component in more detail, starting with the one everything else is built to serve.
Component 1: What is a measurement framework?
Knowing what to measure, how to measure it, and where to look next
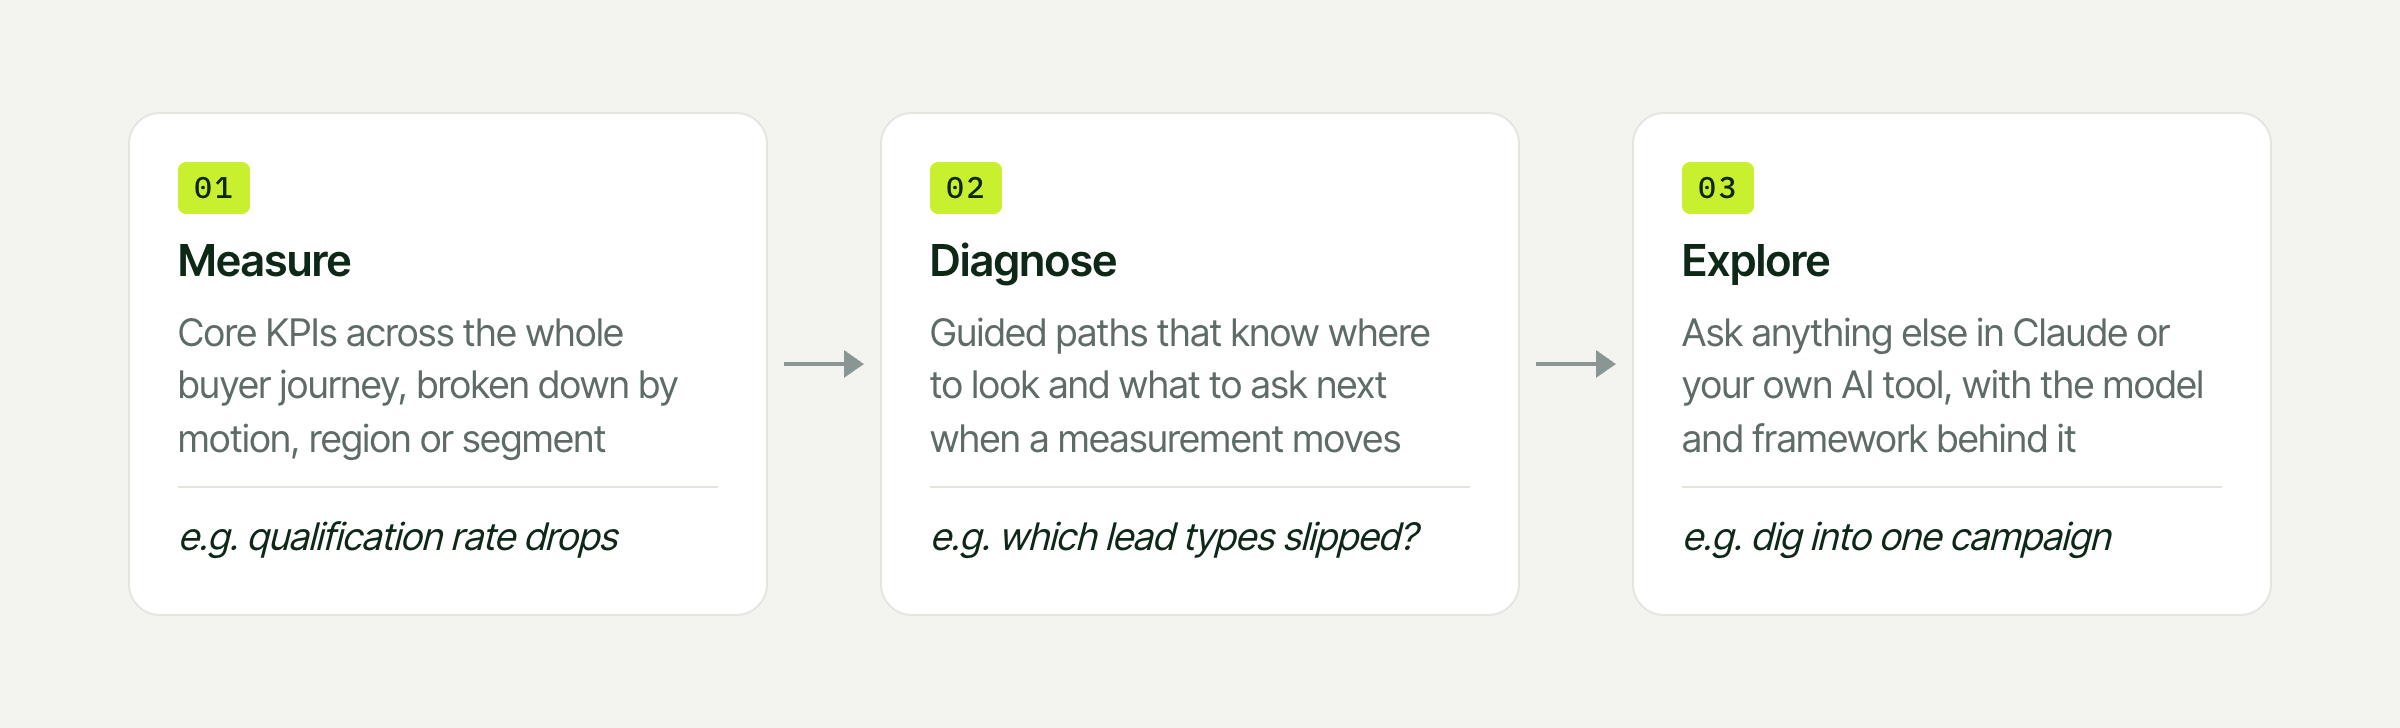
Everything starts here. Before you can model or classify any data, you need to know what you're trying to measure, how each measurement should be calculated, and where to look and what questions to ask when a measurement surfaces a trend you want to analyze. That's what a measurement framework gives you. The data model and the semantic layer exist to serve it, and it works in three layers.
Measure. It starts with defining the core KPIs that cover the entire process of creating revenue, not just fragments of it. A lot of marketing measurement today focuses on one slice, like opportunities created, credited to whatever the buyer touched last. A complete framework covers each part of the buyer journey: how people engage with your marketing, how leads get handed to sales and qualified, and how opportunities are created and won. On top of those, it adds the operational metrics that show how efficiently things move from one stage to the next, like what share of leads sales qualifies, how long that takes, and how often opportunities close. And every one of those measurements should be something you can break down by opportunity type (like new business or expansion), region, business unit or customer segment, so you can see which parts of the business are working and which aren't.
Diagnose. When a KPI moves, the next question is understanding why. There's a real art and science to analyzing a trend: knowing where to look, and which questions to ask to get to an actual answer. If inbound pipeline is down, which channels and campaigns are potentially driving that trend? If fewer leads are turning into pipeline, are certain types of leads qualifying at lower rates, or is sales following up more slowly? What engagement happens before opportunities are created? A good framework builds those paths in, so the analysis starts in the right place instead of from scratch.
Explore. For everything else, you ask in Claude or your own AI tool, with the model and framework behind every answer, so the deep dives start from something reliable.This is where asking AI one question at a time falls short. Each answer might be right on its own, but pieced together they don't show you the bigger picture. Most teams can measure the opportunity end of the funnel. Very few can see engagement and prospecting this way, and that's usually where the biggest gaps are.
Even a seemingly straightforward measurement has layers of decisions behind it. Take event-influenced pipeline. Which events count? Does registering count, or only attending? How long before the opportunity does engagement still matter? Whose engagement counts: the eventual buyer, or anyone at the account? Which opportunity types are included? Every answer changes the number. A good framework makes those decisions once, deliberately, and applies them the same way every time, from how certain things are classified across buying stages to how influence, lift and lead hand-off metrics are calculated.
It's easy to underestimate the skill this takes. The teams we've talked to that do it in-house usually rely on support from a data engineering team, operations staff and data scientists. They build and run their measurement logic in dedicated environments, on platforms like Databricks or with open-source tools, with technical people to set and maintain the definitions and the infrastructure to support them. These rules need a home, and someone who owns them.
Component 2: What is an analytical data model?
Data your systems were never architected to track, without the architecture work
This is the heart of getting the most comprehensive view of marketing performance, and where most of the complexity lives. A complete picture of marketing doesn't come from the data alone, or from asking AI questions. It depends on what goes into the data model, and the model is shaped by what the measurement framework needs.
Passetto's data model takes marketing and sales activity and reconstructs it into the entities and relationships marketing questions actually depend on, which in many cases source systems don't hold on their own. Some companies choose to build those structures themselves, but it's time-consuming and resource-heavy.
In all our work with customers, we see the same thing again and again: basic, important processes that should be tracked a certain way aren't. That's almost always an architecture issue, and architecture is one of the most time-consuming things to build or change. It's the main reason companies bring on tools in the first place. Passetto, like any enterprise-grade analytics platform with a proprietary data model, is designed to give you data you don't have, without you having to do that architecture work yourself. That's where the biggest value is.
Your CRM and MAP are built to record transactions: a form fill, a contact, an opportunity. They aren't built to describe how revenue creation actually happens as a stitched-together process, which is why reports pulled directly from these systems struggle to answer the million-dollar questions marketing gets asked. Passetto's analytical data model closes that gap. It doesn't work from raw records alone. It works from data that has already been cleaned up and mapped to a single, consistent set of definitions (more on how that happens in Component 3). The model then takes those standardized records and reconstructs them into a picture of how buyers move from first engagement to closed deal.
Passetto's model does several things that source systems can't inherently do on their own:
- Treats revenue as a process. It organizes activity into distinct stages, so you can see where marketing contributes and where buyers stall.
- Defines what counts. It carries the rules for which marketing engagement is meaningful, and which isn't.
- Segments opportunities. New business, expansion and other opportunity types behave differently, and need to be measured differently.
- Finds the people behind each account. It knows where to look to connect people and their engagement to an account, even when they aren't tracked cleanly.
- Tracks every attempt to convert a lead into an opportunity. This is the stage of the buyer journey companies inherently track worst. Most systems overwrite each attempt, so important history disappears.
Together, these create entities and relationships that don't exist in your source systems, such as individual MQL / prospect lifecycles, which is every sales pursuit/attempt to convert contacts or MQLs from marketing into opportunities, and buying committees that aren't tracked cleanly inside the system. That's where most gaps in marketing reporting come from. In most cases, the data exists. What's missing is the structure that connects it.
Getting that structure internally usually means re-architecting your own systems, which takes technical work, time and change management, and can be a real burden on the business. What makes Passetto different, along with other purpose-built platforms, is that it ingests your source data and transforms it into the data model outside your systems. That means you get the answers and measurements without having to change anything inside your CRM or MAP.
It's also the hardest part to get right. Passetto's model is the product of years spent working with B2B companies, identifying the same gaps again and again: the things CRMs and MAPs don't track, and were never designed to track, on their own. It reflects decades of combined experience in RevOps, marketing operations and measurement.
Why do the most valuable metrics have to be reconstructed?
Some of the most valuable marketing metrics don't exist in any CRM until they are reconstructed from the underlying activity.
What happens after marketing hands a lead to sales is the classic example. It's the source of the oldest argument in B2B: marketing says sales didn't follow up, and sales says the leads were bad. Settling it takes metrics like these, each broken out by lead type, meaning the reason someone became an MQL in the first place (a web form, an event handraise, a referral, a content download and so on), and tracked for every MQL / prospect lifecycle:
Many systems aren't built to track this with the level of sophistication it requires. Out of the box, a CRM usually treats a person as a lead once: it records where they came from and when they converted, and that's it. You can get further with a custom object in your CRM, or by modeling it in a BI tool, but that typically takes a strong RevOps and technical team to build and maintain.
But that isn't how B2B buying works. It's actually unusual for someone to become a lead once, convert and turn into an opportunity. More often, they fall in and out of the MQL / prospect lifecycle several times. They download something, become a lead and get passed to sales, but it isn't the right time, so they're recycled. Later they do a few other things, become a lead again and get disqualified. Then they come back a third time, and this time they convert. Each of those is its own cycle, with its own path from engaging with your marketing, to talking with an SDR, to working with a seller, and each one holds patterns of data about what's working and what isn't.
With a typical lead record, those fields are overwritten every time something new happens, so that history is lost.
Think about how a hospital handles an emergency room visit. Every visit is recorded on its own: when you arrived, how long you stayed, why you were there, which doctor treated you, what you left with and who discharged you. If you come back two weeks later, the hospital doesn't overwrite your first visit. It creates a new record. Come back three months after that, and there's a third. So if anyone ever needs to understand how you got here in the first place, the full history is there.
B2B buying needs the same thing: a record of where each buyer started, everything they did along the way, and every time they talked to your SDR team, because that's where the real insight into what's working lives. That's exactly what Passetto's data model reconstructs.
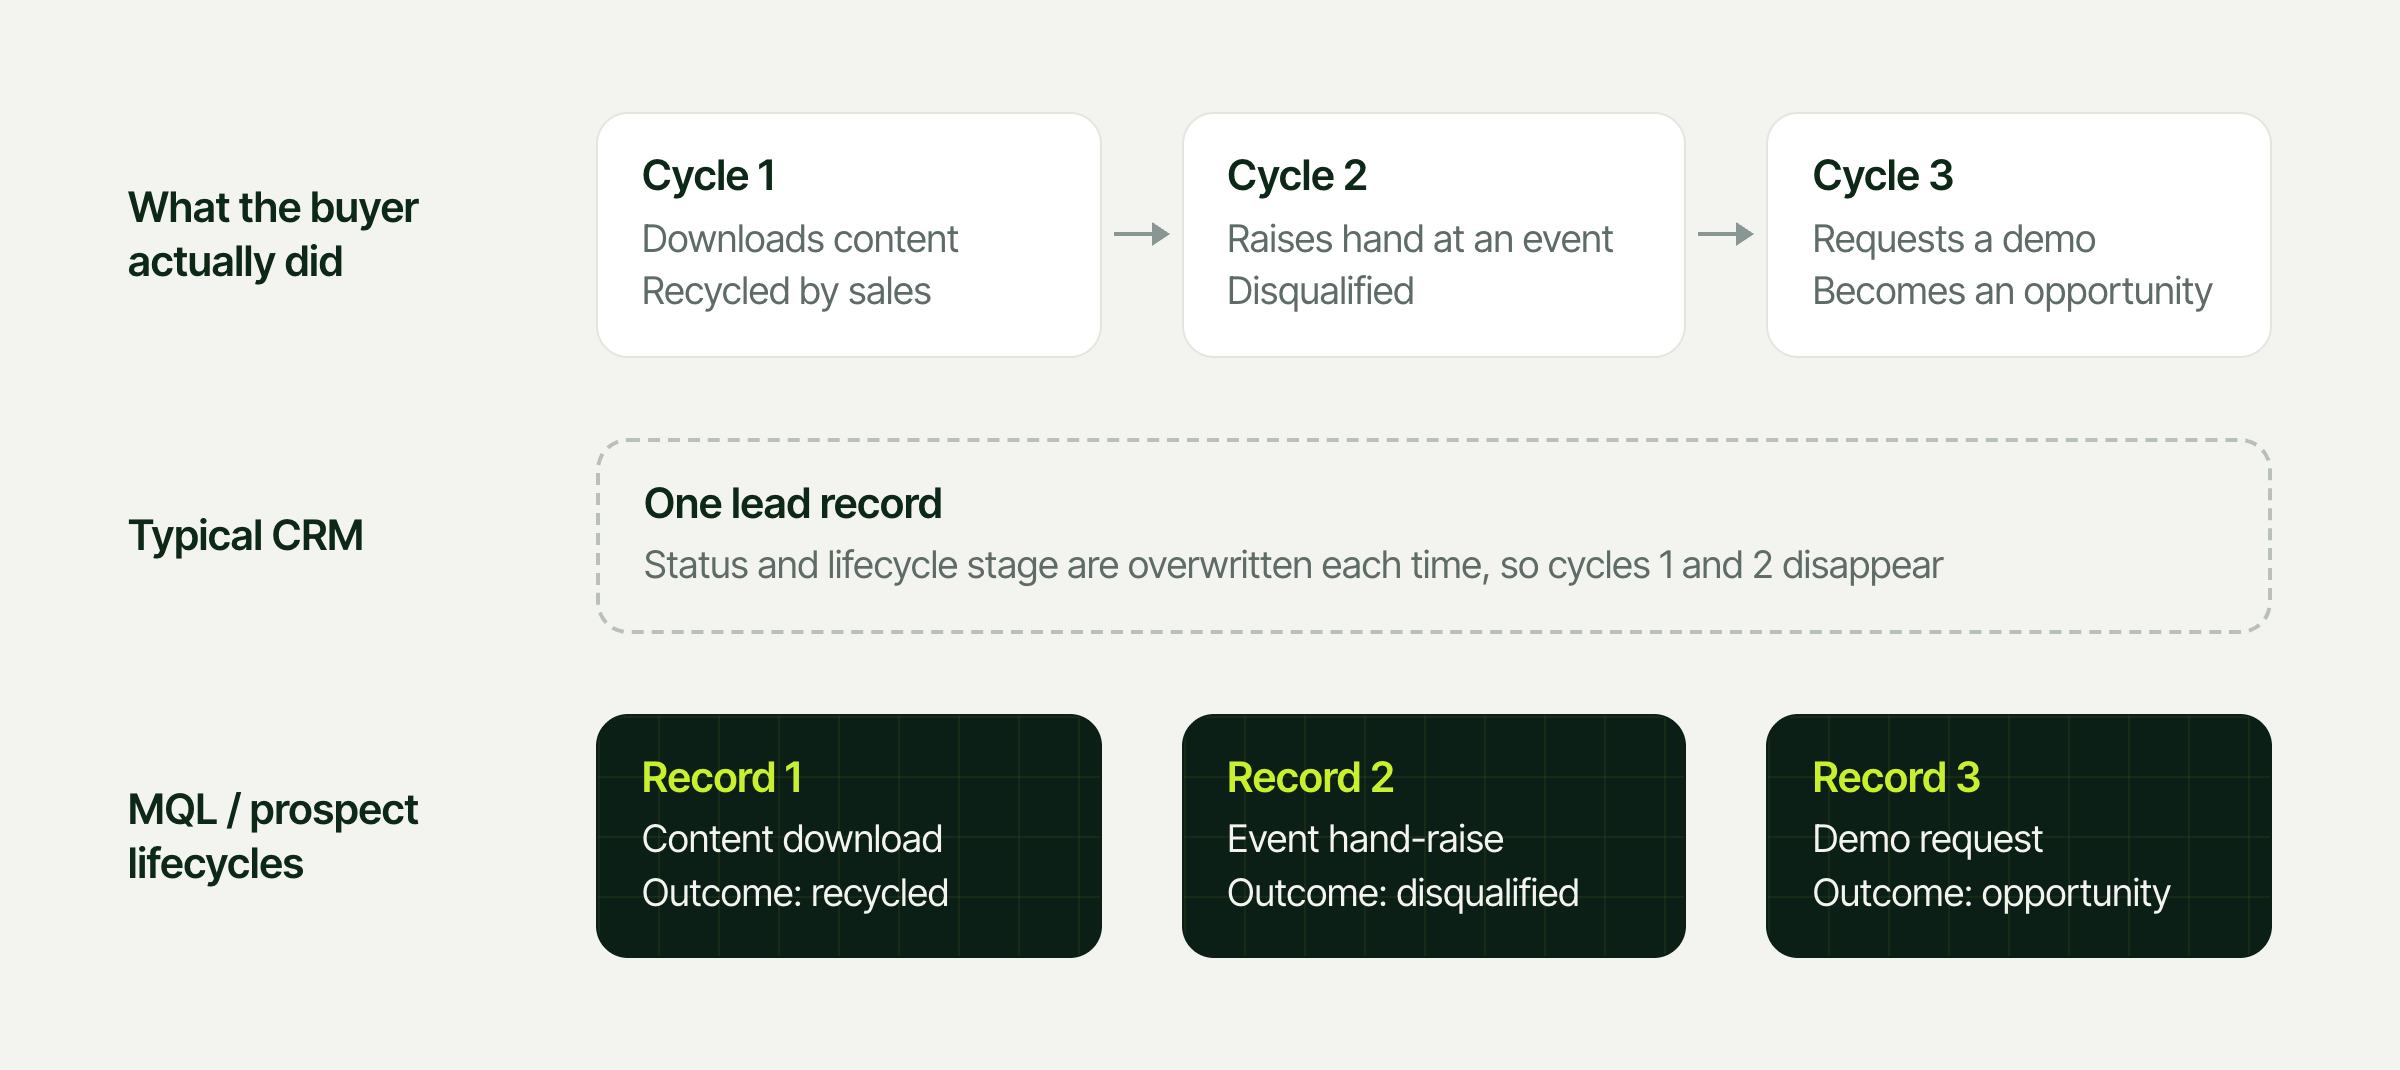
None of these are native reports in HubSpot or Salesforce. Building them yourself means reconstructing each MQL / prospect lifecycle, attributing a lead type to it, and joining it to sales activity and opportunity outcomes. That is significant architecture work, and it has to be maintained every time your process changes.
The payoff is concrete. After a trade show, you can see whether sales followed up on the leads, how fast, and how many went nowhere, broken out against your web form and referral leads. That turns a political argument into a shared fact.
Component 3: What is a semantic layer?
How it turns raw data into business meaning
A semantic layer is a translation layer between raw data and business questions. It defines what the data means, how entities relate to one another, and how business metrics should be calculated. AI reasons from the context it's given, and the semantic layer is that context.
In technical terms, much of this work is ETL: extract, transform and load. You extract the raw data from every system you use, transform it into one consistent set of definitions, and load it somewhere it can be modeled and queried. It sounds simple. In practice, the transform step is where almost all of the work lives.
It's what the data model and the measurements run on. The infrastructure around it ingests, transforms, validates and maintains that data, so results stay reliable across very different customer environments.
Imagine a CMO asks Claude: "What's our marketing-influenced pipeline this quarter?" To answer correctly, Claude needs to know:
- What qualifies as marketing influence?
- What counts as pipeline?
- Which opportunity date determines the quarter?
- Which contacts are associated with which opportunities?
- What happens if the account has no contacts at all?
- Should engagement from other people at the account count, and if so, whose?
- What happens when lead and contact records are duplicated or never merged?
- What happens when a contact engages before an opportunity exists?
- How should contacts tied to multiple opportunities be handled?
- What happens when an opportunity is reopened?
- Which activities count as meaningful marketing engagement?
- How do you avoid counting the same opportunity more than once?
None of these questions has a universally correct answer. They're business definitions that need to be established, implemented, tested and applied consistently.
Without a semantic layer
AI has to guess. It picks what it thinks is most probable to be correct, and the answer can vary heavily depending on how the question is phrased. The result is wrong in ways that are hard to detect. Over time, conflicting definitions across teams and reports build up into semantic debt.
INSERT TABLE!!!!
With a semantic layer
Definitions and criteria are set once and enforced consistently everywhere. Think of it as controls for reading the same information the same way, every time: structured, governed definitions for how to reach an answer, built into the foundation. It also removes the bottleneck of double-checking AI output every time something doesn't look right.
INSERT TABLE!!!!
How much classification is involved?
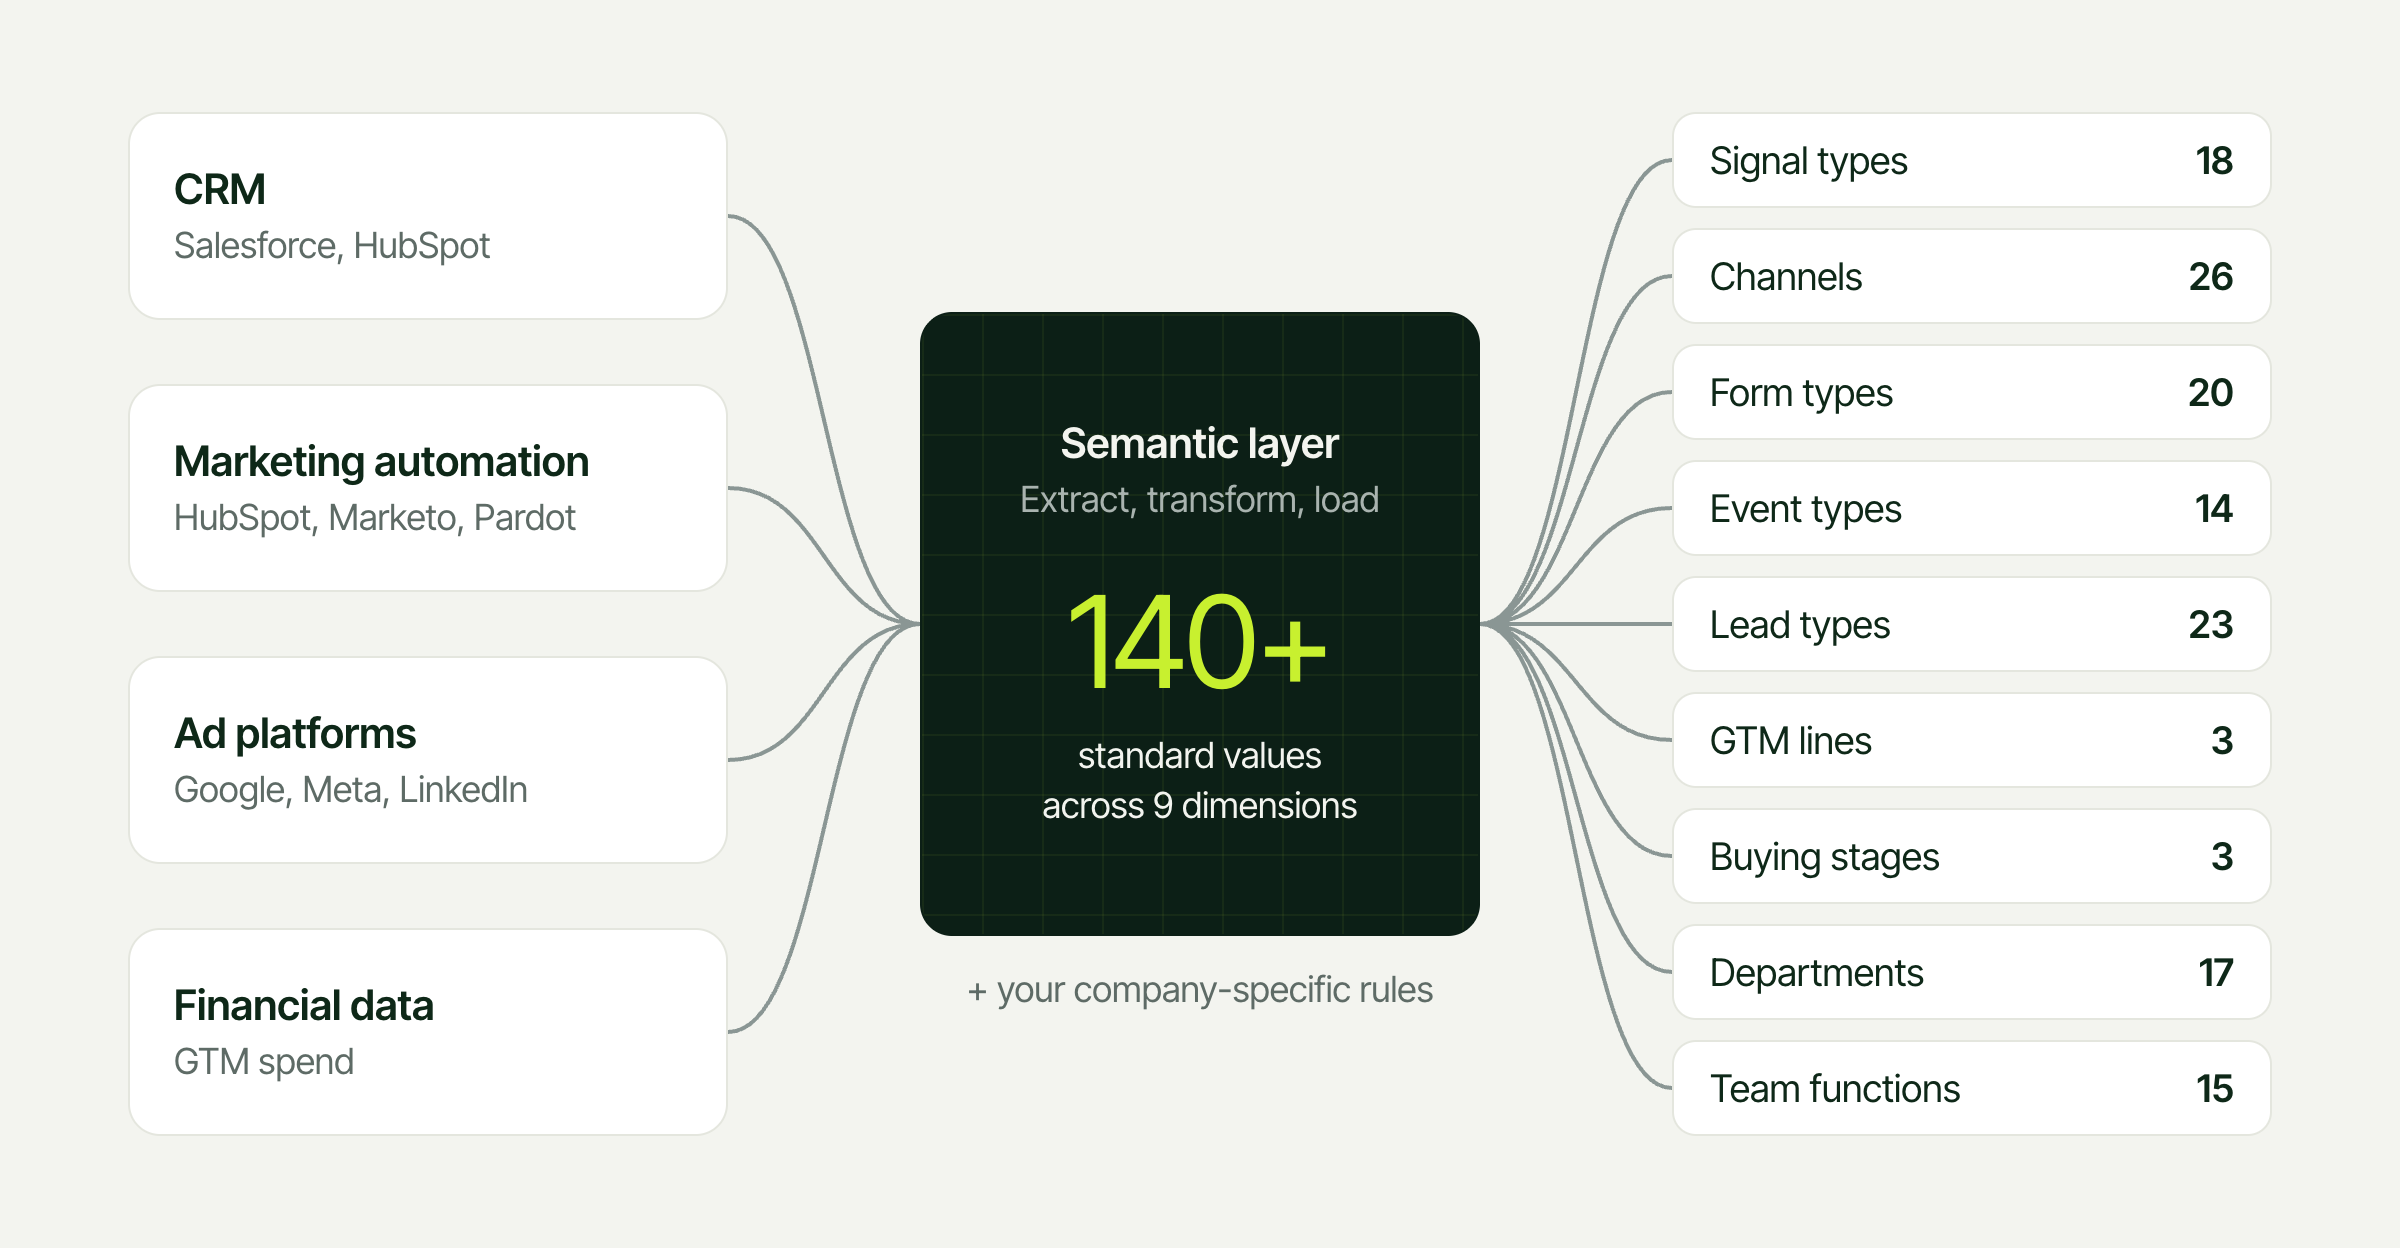
Classification is the heart of a semantic layer, and it's easy to underestimate how much of it there is. Every raw record from every tool, whether it comes from your CRM, your marketing automation platform, your ad platforms or your spend data, has to be sorted into the same set of categories. These are the nine dimensions Passetto classifies every record into:
INSERT TABLE!!!!
That's more than 140 standard categories before adding a company's own. Each one has structured rules behind it that decide what goes where, and those rules have to be maintained continuously as new forms, campaigns and sources show up. Miss one, and whole channels quietly go uncounted.
Where does a semantic layer live?
A semantic layer can't be built and maintained by a single person. It requires technical rigor and alignment across the organization, and it has to be aligned on, defined, built and certified before people rely on it.
It also needs to live in a central place the whole organization can use, not inside individual Claude conversations, in documents, or in an individual's head. In most organizations that do this well, it sits on top of a data warehouse like Snowflake, BigQuery or Databricks, and the definitions are managed in a dedicated semantic layer tool, such as the dbt Semantic Layer, Cube or Looker's LookML, or in the semantic models of a BI platform like Power BI. The definitions are typically version-controlled, so every change is reviewed and tracked, and every tool that connects to it, including AI, uses the same logic. That's what makes semantic governance possible, while still giving people the autonomy to explore the data on their own.
Think of it as a set of instructions for how your data should be read. Those instructions could technically live in a document, in someone's head or in a prompt. But to become the governed foundation the whole organization relies on, they need to be stored somewhere structured, adopted and understood across teams, and actively maintained as your systems change. Otherwise, every answer is only as consistent as whoever wrote the prompt.
Can your CRM do this on its own?
CRMs and MAPs like HubSpot and Salesforce can hold some shared business logic. Custom properties, calculated fields, custom objects, formulas and reports let a company define things like:
- What constitutes a marketing-qualified lead
- How pipeline generated is calculated
- Which campaigns are associated with opportunities
- How acquisition channels are categorized
For straightforward reporting, that can be enough. But a CRM isn't equivalent to a dedicated data warehouse and semantic modeling environment. Things get much more complicated when you want to reconstruct historical buyer journeys, resolve relationships between people and opportunities, or analyze how marketing engagement correlates with commercial outcomes.
Is a semantic layer enough on its own?
A company could have immaculate CRM hygiene, perfectly standardized fields and a functioning semantic layer, and still be unable to answer the questions that matter most about marketing's contribution to revenue. There are two reasons.
Definitions can't fix missing structure. If contact-to-opportunity relationships are missing, lifecycle histories have been overwritten, or marketing activity is fragmented across systems, defining the metric doesn't magically make it accurate.
The most valuable questions need an analytical model your CRM doesn't contain. Answering them means creating new analytical data, not just interpreting existing data differently.
Example: reconstructing sales pursuits
A contact engages with marketing in January, enters a sales cycle in March, loses that opportunity in May, and re-enters another sales cycle in September. To measure marketing's role, you need to determine which interactions belong to which pursuit, what happened before each opportunity, and how those interactions relate to each outcome.
That isn't a calculated property. It requires an underlying data model designed to represent those relationships and events.
Questions a semantic layer doesn't know to ask
- Which marketing interactions occur most often in successful deals?
- How do engagement patterns differ between won and lost opportunities?
- Which channels contribute before opportunities are created, versus during active sales cycles?
- How does marketing engagement correlate with win rate, deal velocity and deal size?
A semantic layer doesn't inherently know to ask these questions, much less how to model the relationships underneath them. That takes a measurement methodology built specifically for B2B marketing, as explained in Components 1 and 2.
Why does AI reporting look simpler than it is?
From the outside, AI reporting looks like a connection and a few good prompts. Here's why it isn't, and where teams most often fumble.
When you connect Claude to HubSpot, Salesforce or another GTM tool and ask about pipeline, for example, it reads the records as they are and picks whatever it judges statistically most likely to be the right data to use. Several things can make the result look right while being wrong:
- There's no go-to-market context. AI doesn't know how your buyers move through a journey, how your business defines leads and MQLs, or that new business and expansion should be measured differently. Without that context built in, every question has to supply it, and most don't.
- Measurement logic doesn't build itself. Calculating KPIs correctly takes a technical understanding of how each one is tracked, careful prompt engineering and, for forecasting, sometimes statistical modeling. It's one of the main reasons teams get different answers from the same data.
- Tracking isn't always set up or used as intended. Over time, tools get misconfigured and systems get used in ways they weren't designed for. Broken tracking, dropped UTMs and duplicate records hide in plain sight, and AI analyzes them as if they were accurate.
The fix isn't a better prompt. The logic for where to look, what counts and how records connect has to live somewhere, and it has to be applied and maintained the same way every time new data flows in.
How complex is the data in your CRM and MAP?
We have worked inside the CRMs and marketing automation platforms of hundreds of B2B companies. Almost every one holds far more complexity than its own marketing team ever realizes.
That isn't a criticism. These systems are built over years, by different admins, integrations and agencies, each solving the problem in front of them. The result is data that works for running the business day to day, but not for measuring how marketing connects to outcomes.
Here is what we find most often.
The same fact, stored many ways
Multiple fields often represent different versions of the same thing. There may be several fields that each capture a version of lead source, channel, or marketing touchpoint, created at different times for different reasons. Which one is right depends on context that usually lives only in someone's head. An AI tool reading the raw data has no way to know which field to trust.
One type of marketing engagement, many places to find it
Inside your systems, teams track first-party marketing touchpoints: records of what people did, or how they interacted with a marketing asset, like your website, your content, your events or your emails. Each type of touchpoint can be captured in several different places. Event engagement is the clearest example. It can come from event campaigns and their member statuses, registrations captured on forms, integrations with third-party webinar and event tools, and list uploads of attendees and badge scans.
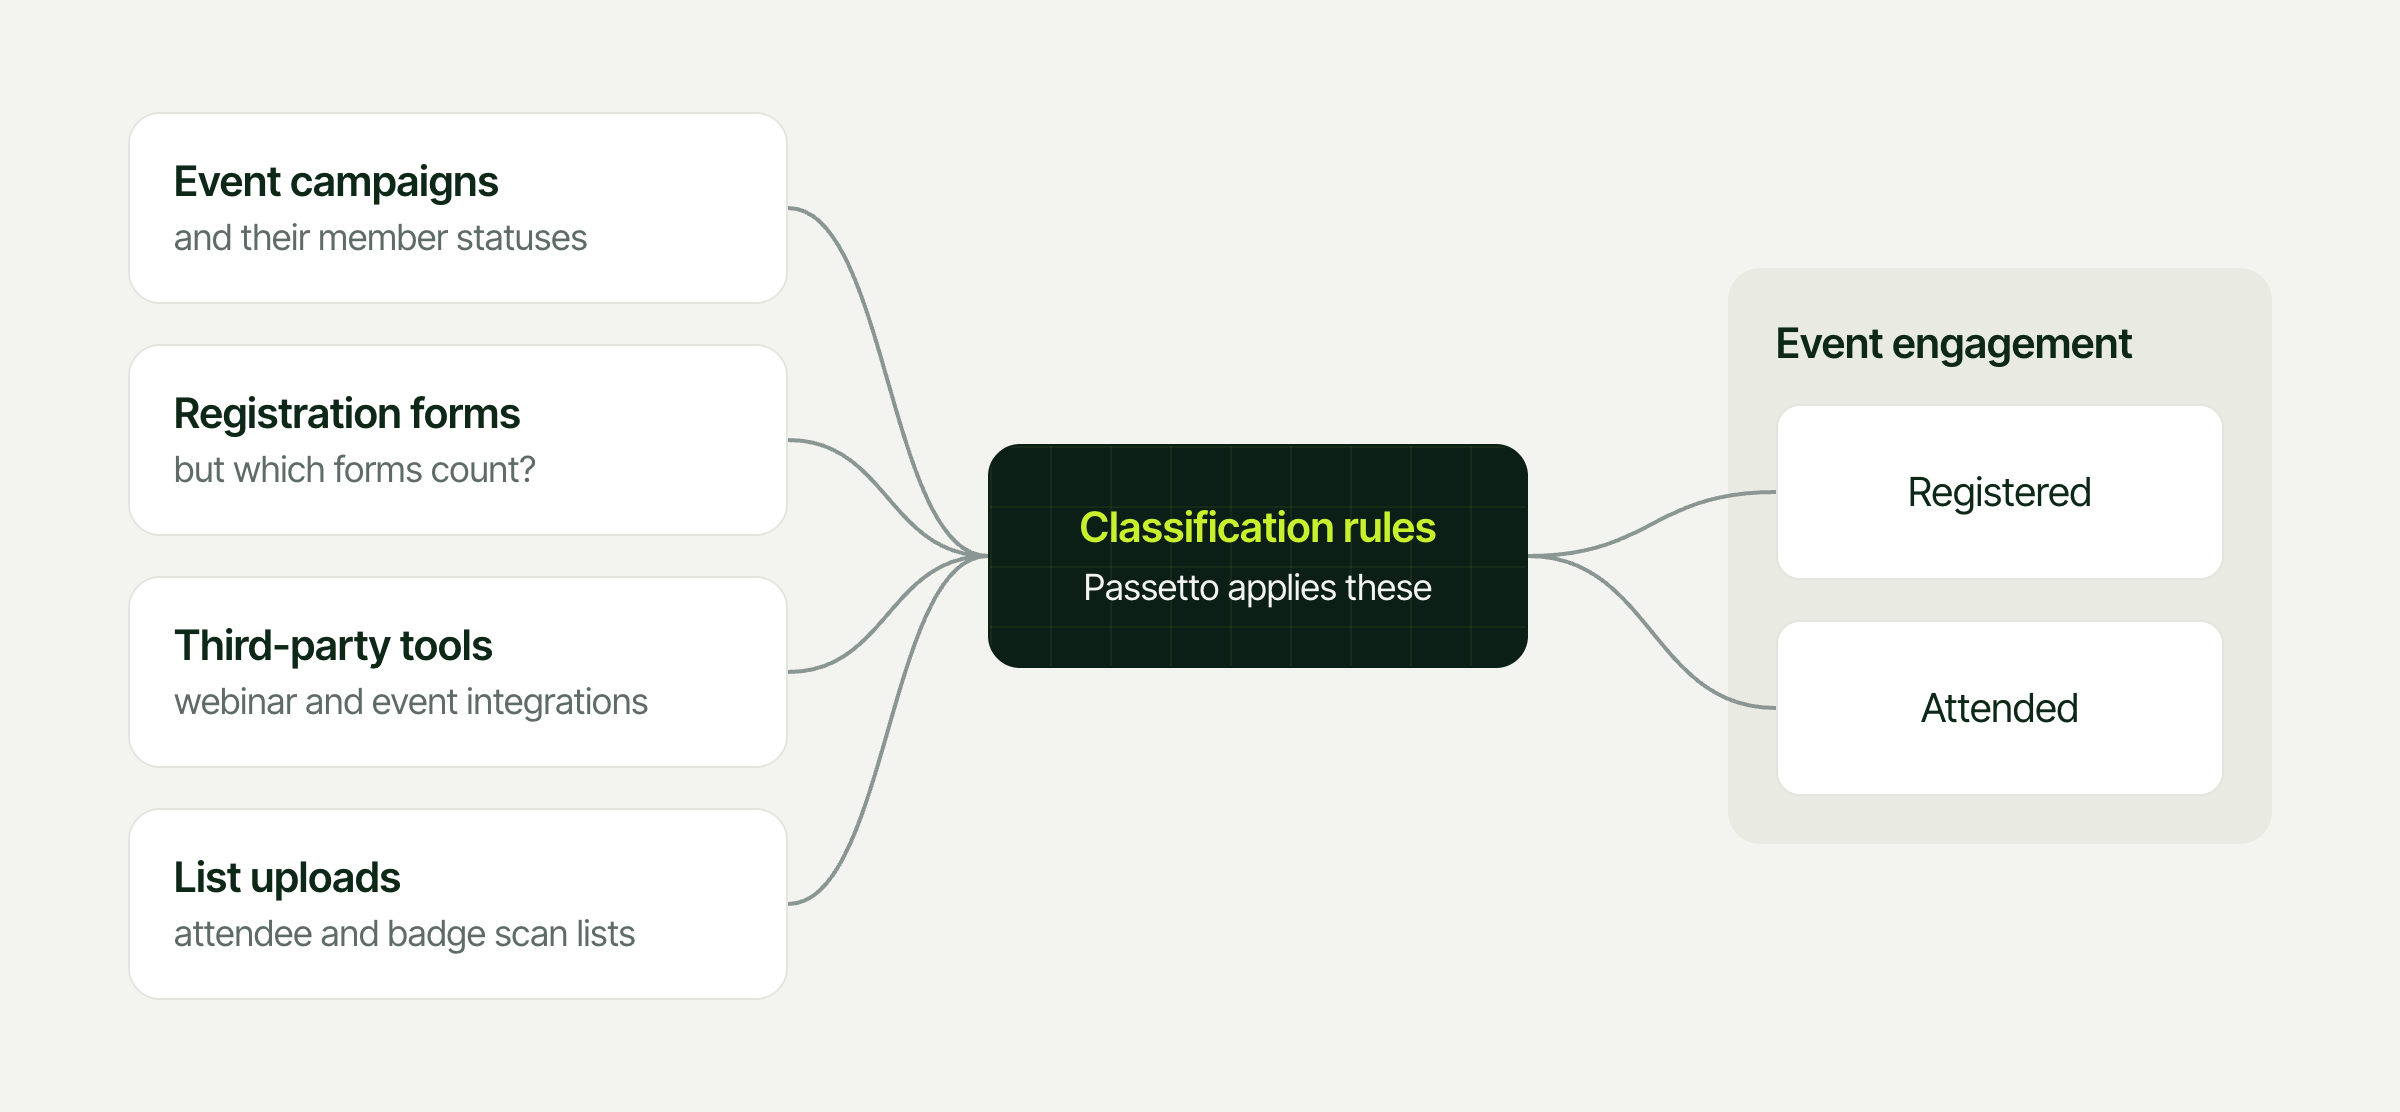
event registrations and which aren't, which campaigns represent events, and which list uploads are attendee lists. Then they have to separate a registration from an attendance, which carry very different weight. HubSpot won't make these classifications on its own, and it's easy for whole categories of engagement to be missed.
Each of those sources needs a rule that says what it represents. Here's what those rules can look like:
INSERT TABLE!!
In Passetto, these criteria are set once and applied automatically as new data arrives, with machine learning helping keep them current as new forms, campaigns and lists appear. That's simple to describe, and much harder to build and maintain in real time.
The same is true of every other signal type. Marketing activity doesn't automatically group itself into types like webinars, gated content, gifting or paid social. That grouping is logic someone has to define and apply.
The same goes for channels. Paid search alone can appear under five or more different names, and HubSpot commonly drops UTM parameters at form submit, so leads from paid campaigns show up as direct or unknown traffic.
Records that never connect
Contacts, accounts or companies, and opportunities are rarely connected the way measurement needs them to be. This is the gap that most often surprises marketing teams.
This matters most with buying committees. The economic buyer reads your content, a technical evaluator attends a webinar, and a third person visits your booth, but often only one of them is attached to the opportunity.
When the CRM and MAP are managed separately, it's very common for multiple lead records to represent the same person. Those lead records are never merged, and they never convert into a contact on an account or company. That means the records where marketing activity is tracked may never correspond to the account or opportunity it influenced. Since connecting marketing activity to outcomes is the whole point of measurement, this one gap can erase a large share of marketing's real impact.
Here's how that plays out. Jordan, a VP of Operations at a target account, downloads an ebook in February, which creates a lead record in your marketing automation platform (MAP). In April, Jordan's badge is scanned at a trade show, and the list upload creates a second lead with a typo in the email address. In June, Jordan registers for a webinar with a personal email, creating a third.
None of those lead records were ever merged or converted. When sales started working the account, a rep simply created a new contact record for Jordan in the CRM and attached it to the opportunity. That contact has no marketing history, because all of Jordan's engagement still sits on the three unconverted leads.
When the deal closes in September, Jordan is on the opportunity, but none of Jordan's marketing touches are. Ask AI what marketing contributed to that deal, and based on the records it can see, the answer is nothing.
The same gap runs in the other direction. Sales often creates new contact records for people on an opportunity that never sync back to the MAP. Since the MAP is where marketing runs its programs, those buying committee members can't be reached with emails, nurture programs or event invitations, and any engagement they do have stays invisible to marketing.
Where do teams usually fumble?
Everything seems easy with AI. But it doesn't just work, and these are the places it usually falls apart, whether a team is building in-house or just pointing AI at their CRM:
- Not knowing where to look. One fact lives in a bunch of different places. If AI doesn't know to check them all, it misses things.
- Assuming everything connects. Event attendance isn't logged properly, or contacts aren't tied to accounts, and marketing gets cut off from the deal.
- Losing the history. Lead status and lifecycle stage get overwritten, so earlier hand-offs disappear.
- Asking questions in a silo. Each answer might be right on its own. Pieced together, they don't show the bigger picture.
- Trusting the black box. AI picks its own method every time. Can you reproduce the answer? Can you defend it?
- Patching with more skills. When one skill fails, teams write another to catch it, and it turns into a domino effect.
- Making it a side-of-desk job. Someone has to own the rules and update them every time new data flows in.
- Keeping it in one person's head. When they move on, the context files and the know-how go with them.
How do building and buying compare?
There's no single right answer. Here's how the two paths compare side by side. The build figures are based on the in-house builds we've seen across our customers and prospects.
INSERT TABLE!!!

What does it take to build it yourself?
You can build parts of this foundation in-house. The real question is whether your team should own a data model, or own the decisions it informs.
What should you plan for?
"Trying to normalize a tool like you're building for all the companies is challenging as hell." – Senior RevOps leader, global enterprise
Based on the in-house builds we've seen across our customers and prospects, the pattern is consistent:
INSERT TABLE
And the team learns by doing. They'll get some things wrong at first and fix them as they go, because that's how this kind of work goes the first time. AI agents can speed up parts of the build, but that cuts both ways: it's easier to build something that looks right, and harder to know whether it is.
What does a complete system include?
INSERT TABLE!!
None of these components is impossible to replicate. But replicating the entire system is a fundamentally different undertaking from connecting HubSpot to Claude.
What does building it look like in practice?
We recently spent time with a global enterprise that chose to build this in-house, and they're doing it well. Four full-time people have spent more than three years on it, with a warehouse migration, a semantic layer, custom AI agents and two more roles being hired. They still run into the same problems every B2B team does, like duplicate accounts hiding event attendance and marketing and sales defining a lead differently, and they don't consider it done. As their lead put it: "There's not a lot of people who have that end-to-end context."
What would you be maintaining?
When teams build this with AI, the context usually ends up spread across YAML files, scripts, skills and prompt notes that only one or two people know their way around. It works until a form or campaign changes and something quietly breaks. A purpose-built platform keeps those rules maintained for you, so everyone gets the same answer and nothing leaves when someone does.
When does it make sense to build in-house?
Building in-house can be the right call. It tends to make the most sense when:
- You already have a data team and a modern data warehouse, and marketing data is a real priority for them.
- Your requirements are unusual enough that no platform's model fits, like a sales motion that doesn't map to standard buying stages.
- You need full ownership of the logic for regulatory, security or strategic reasons.
- You have the budget and patience for a build that takes at least a year, and leadership is committed to maintaining it long-term.
- Marketing measurement is one part of a broader, company-wide data strategy you're building anyway.
It tends to make less sense when marketing is the main team asking for answers, the data team is stretched across other priorities, or you need numbers you can trust this quarter.
And it doesn't have to be either-or. Some teams use a platform for marketing measurement and feed the results into the broader data stack they're building.
How should you decide?
If your RevOps team tells you they can build this, they may well be right. The goal isn't to talk anyone out of building. It's to make sure the decision gets made with everything on the table. Work through these questions with marketing, RevOps and whoever would own the build:
- What questions do you need answered, and by when? If leadership needs answers this quarter, a build that takes a year or more won't get you there.
- Who would own it, and would it be their full-time job? This can't be a side-of-desk project. If no one owns it, it won't stay accurate.
- Do you have the skills in-house? You'll need GTM data knowledge, measurement expertise, data engineering and statistical modeling on the same team.
- What's the true cost? Compare fully loaded salaries, tooling and time to value, not just license fees.
- What happens when the person who built it leaves? If the honest answer is "we start over," that's a risk worth weighing.
- Is marketing measurement the best use of your data team's time? If it competes with other priorities, it will fall behind.
- How will you know the numbers are right? Whichever path you choose, you need to be able to explain and defend how every number was calculated.
How does Passetto approach it?
We built Passetto to be the foundation underneath AI marketing analytics, so the answers you get in Claude or ChatGPT hold up.
We've built a business around this problem. Our RevOps experts and developers have worked inside the CRMs and MAPs of hundreds of B2B companies, and what they've learned is built into the logic Passetto applies to yours: which fields to trust, where each type of engagement hides, how to reconnect records across systems, and how to define and calculate each measurement. Much is possible with AI. Passetto makes sure what it's reading is complete, connected and structured.
Passetto isn't simply interpreting your existing data differently. We create new analytical data from it. We reconstruct buyer journeys, create relationships that don't exist in your source systems, and calculate performance metrics your CRM was never designed to produce. That intelligence then becomes accessible through AI, giving you answers you can't get by connecting Claude directly to your CRM.
Our proprietary value comes from three areas:
- The analytical data model. The architecture that reconstructs and connects historical marketing and sales activity into new analytical entities.
- The measurement methodology. The rules and calculations that turn those relationships into meaningful measures of marketing's contribution.
- The operationalized infrastructure. The ingestion, transformations, validation and maintenance that make the model reliable across very different customer environments.
Passetto connects to your CRM and marketing automation platform through their APIs. It applies the three layers described above: it finds and classifies every marketing signal, reconnects orphan contacts and reconstructs every MQL / prospect lifecycle, and applies a built-in go-to-market measurement model with your own business rules on top.
Passetto MCP, now out of beta, plugs that foundation directly into the AI tools your team already uses. Out of the box, you get structured skills for the measurements that matter most. Anyone on the team can run them and get the same answer.
That means you can open Claude and ask for the win rate lift on open opportunities tied to your recent trade shows, and trust what comes back.
Every new customer starts with a hands-on onboarding. Over the first 30 days we map your data, define your lead types and MQL criteria with you, and deliver an initial rapid marketing performance assessment using your data.
What do customers say?
"Salesforce and HubSpot give us plenty of data, but identifying the specific marketing signals and triggers that influence pipeline and closed-won deals is notoriously difficult. Passetto reduces that friction by connecting our data and giving us a clearer, more actionable view of what is truly driving revenue."
Colleen Wanty, VP of Marketing
"Having trusted, governed data available directly in ChatGPT completely changes how quickly you can answer complex revenue questions with confidence. It removes so much of the back-and-forth while ensuring the data remains trustworthy."
Ryan Chandy, Revenue Operations Leader
"Working with Passetto has been a game-changer for my team's marketing visibility. They turned previously opaque performance data across our website, content, and paid media into crystal-clear, custom reports designed specifically around our business goals. Beyond the tech, Passetto acts as a true strategic partner, providing insights that help us iterate faster and continuously elevate our creative strategy."
May Pryor, Senior Director of Brand Strategy, Content, and Creative
Want to see it on your data? Contact Passetto to set up a walkthrough.
Frequently asked questions
How do I connect HubSpot or Salesforce to Claude or ChatGPT? Both platforms offer ways to connect, through native connectors or MCP servers, and third-party integration tools fill the gaps. Setup is usually quick. The harder part is what comes next: AI reads your raw records as they are, so the accuracy of the answers depends on the structure and definitions underneath.
Can't I just connect Claude to HubSpot or Salesforce? You can, and it will give you answers. But it reads raw records as they are, guesses which fields and logic to use, and can give a different answer each time. That's fine for quick lookups. For numbers you'll present to leadership, you need the structure underneath.
Is AI-generated marketing reporting accurate? It can be, when it's built on structured, governed data with clear definitions. Pointed at raw CRM data, it often isn't. It guesses where to look and how to calculate, and the answer can change depending on how the question is asked. The polish also makes errors harder to spot.
Why don't my HubSpot and Salesforce numbers match? Usually because the two systems store and define things differently. Sync rules, duplicate or unconverted lead records, different lifecycle stage logic and fields that only live in one system all cause the numbers to drift. Until one agreed definition is applied to both, every report depends on which system it came from.
What's the difference between marketing-sourced and marketing-influenced pipeline? Marketing-sourced pipeline is opportunities that started with a marketing touch, usually the one that created the lead. Marketing-influenced pipeline is any opportunity where marketing engaged someone on the buying committee at any point. Sourced shows what marketing started; influenced shows how much of the business marketing touches. Both depend on defining what counts as meaningful engagement and connecting the right people to each deal.
Do I need clean data before using AI for reporting? Clean data helps, but it isn't enough on its own. Even clean data doesn't record things like repeat MQL / prospect lifecycles or buying committees, and it doesn't define how each metric should be calculated. Messy data makes it harder, but the same considerations apply either way.
What is a semantic layer, in plain terms? A set of rules that translates raw data into business meaning, so every tool and every person reads the same data the same way.
How long does it take to build this in-house? In the in-house builds we've seen, teams typically spend at least a year, often 12–24 months, before the answers can be trusted, with 3–5 dedicated people, and the work continues after that.
Does a platform replace my CRM or data warehouse? No. A platform like Passetto connects to your CRM and marketing automation platform through their APIs and works alongside your existing systems. Nothing changes inside them.
Can we use a platform and still build our own? Yes. It doesn't have to be either-or. Some teams use a platform for marketing measurement and feed the results into the broader data stack they're building.
How quickly can we see results with Passetto? Onboarding takes about 30 days and ends with an initial marketing performance assessment using your data.

Budget Analysis
Measurement
Why Marketing Leaders Need to Measure GTM Efficiency to See Where Their Budget Is Working, and Where It’s Bloated
How B2B CMOs use Cost of Growth to measure GTM efficiency, the most financially defensible way to tie marketing spend to business performance.